AUTOMATED DATA WAREHOUSE FOR AN ACADEMY
[PostgreSQL, Supabase, n8n, APIs, Power BI]


Introduction: Why I'm doing this project?
💡Creating a business from scratch
Launching an online business from zero is a demanding challenge. It requires not only a solid idea and a valuable product but also a well-structured data warehouse to manage information—and the time to bring all of it together.
🎓 Building a digital academy
That’s how my partner and I created an online science academy called VioletAcademy. It delivers:
1) Academic support services, including personalized study plans and responses to student questions in under 24 hours.
2) A library of resources—PDFs, theory videos, practice exercises, and complete Selectividad exams. Everything was designed to be shorter than the official material, visually polished, well-structured, and easier to understand.
⚙️ What’s my role in the company?
She focused on developing the academic content and publishing on social media, while I took charge of the technical side: designing and maintaining the database, automating time-consuming tasks, running business intelligence analyses (funnels, leads, social insights in Power BI), setting up Thinkific as the course platform, building the website, and handling IT services in general. In this portfolio project, I’ll highlight the three areas most relevant to data analysis: data modeling, automation, and BI.
📊 Results through data & automation
As this project unfolds, three key benefits become clear:
1) Significant time savings: over three hours a daythrough automation.
2) Higher quality and reliability thanks to a robust database that ensures full traceability of information.
3) Valuable insights into sales, student behavior, and social media performance.

Architecture and Data Warehouse
The project combines two storage layers: Google Sheets, used as a staging area and log repository, and Supabase/Postgres, the main relational database to store and analyze via SQL all the information.
1. COMPARING GOOGLE SHEETS VS SUPABASE AS STORAGE LAYERS

Pros
Easy to use and accessible for all team members.
Supports simple automations through Apps Script.
Works as an additional backup for critical data.
Real-time collaboration without extra configuration.
Cons
Performance drops significantly with larger datasets.
Lacks relational database features.


Pros
Enables relational schema with keys, IDs, relations.
Supports SQL queries: precise analysis, filtering.
Provides authentication and role permissions.
Scales with datasets and supports modern apps
Cons
Requires technical knowledge of SQL and database management.
Less intuitive for non-technical users.
2. OPERATIONAL TABLES TO CAPTURE EVERY BUSINESS PROCESS
The database design includes multiple operational tables:

Users: information about students registering in the academy.

Orders: data obtained about each purchase in the academy

Invoices: data realted to users and orders to create invoices

Preguntas_email:queries received through Thinkific, the website, Gmail, or WhatsApp.

Conversaciones_email: all messages received in the academy’s inbox, necessary for workflows that build replies on top of previous threads.

N8n_conversation_history: memory of AI agents to keep track of past email interactions via thread ID.

RAG documents: embeddings and vectorized PDFs to power AI agents with domain-specific knowledge.

RRSS tables: six in total (three fact, three dimension), storing metrics from Instagram, YouTube, TikTok, and Facebook.

Blog tables: three tables storing blog-related content, metadata, and performance data.
3. AUTOMATED DATABASE UPDATES AND KEY AUTOMATION TRIGGERS
The database is updated automatically—never manually—to ensure consistency and save time. Updates are handled mainly through APIs and webhooks in n8n, along with a bit of Zapier thanks to his direct and easy integration with the platform Thinkific.

Before diving into workflows, it’s worth clarifying automation basics. Automation relies on two types of triggers: event-driven (actions like a new order or email received) and scheduled (time-based checks such as scanning Sheets every few minutes).

4. EMBEDDING GOVERNANCE AND DATA QUALITY FROM THE START
Data governance is the foundation for trustworthy analytics, ensuring that data remains consistent and reliable. Strong data quality practices are equally critical, as they prevent errors from propagating and guarantee that every insight is based on accurate information.
1) Naming conventions: Clear and consistent naming is the first step toward maintainable databases. Each column follows predefined rules, all documented in an index (e.g., user_id, order_date), so that any developer or analyst can instantly understand the data structure.


2) Error handling: No automation is perfect, so handling failures is essential to prevent broken processes. Workflows retry up to three times when an error occurs, logs are all stored for every execution, and I also receive email alerts if issues persist.
3) Data quality: Reliable insights depend on strict validation rules that keep bad data out of the system. Invalid timestamps are blocked, required fields (emails, dates) are enforced, and null values are prevented where they shouldn’t exist.


4) Schema validation: Enforcing strict data types ensures long-term stability and accuracy. Every column is typed (text, date, decimal, etc.), maintaining consistency across workflows and preventing mismatches during queries or analysis.

ANALYTICAL MODEL AND SQL FOR BUSINESS INSIGHTS

The analytical layer in Supabase works as an ODS (operational data store) with relational tables that capture business operations. Users and Orders act as fact tables, loaded via Zapier + Thinkific, but other tables that store info such as emails, conversations, RAG docs, blog, are designed as operational tables to capture full activity. Social media, however, was built specifically for BI, with a star schema: three fact tables (FactPosts, FactAudience, FactDemographics) and three dimensions (DimDate, DimPlatform, DimContent).
Typical analyses (non-code related) go beyond storage and focus on transforming information into actionable insights. They help measure performance, understand student behavior, and evaluate strategy effectiveness within the academy. They also show how users progress through the learning journey, remain engaged, and the overall value each student brings.
Funnels
Funnels: show how users move step by step through the conversion journey—from initial visit to becoming a paying student.
Example: 100 leads visit the website, 60 register in Thinkific, and 20 end up purchasing a course (20% final conversion rate).

Cohorts
Cohorts: analyze groups of students based on when or how they first purchased, and measure their behavior over time.
Example: students who buy Block I of the course—60% of them go on to purchase Block II within the next three months.

Retention
Retention: measure how many students stay active over time (through logins, forum activity, or course progress). This highlights satisfaction and long-term engagement.
Example: 70% of students remain active after the first week, but only 30% after the first month.

LTV (Lifetime Value)
LTV (Lifetime Value): calculate the total average revenue generated by each student across all their purchases.
Example: a student may buy one block, two blocks, or the entire course, resulting in different total values per user.

Engagement
Engagement: capture the depth of student interaction with the academy—going beyond simple logins to include activities like posting in forums or replying to emails.
Example: measuring how many students actively participate in discussions versus those who only log in to view content.

What about using SQL to extract key metrics?
With SQL on Supabase (Postgres), I can build materialized views and queries that join across users, orders, invoices, questions, and social stats. This enables funnels, cohorts, retention, and campaign analysis without spreadsheets. Examples:

Cross-sell:
Find users who bought one block but not another (users + orders).

Coupon effectiveness:
Compare average order value and retention for coupon vs. non-coupon users (orders + invoices).

Regional performance:
Aggregate revenue by region_autonoma (users + orders).

Response time:
Measure delay between a question (preguntas_email) and the first reply in n8n_conversation_history.

Workflow A — Registration & Welcome
Objective
Automate the onboarding process: capture new users and orders from Thinkific, store them in Postgres, and send a personalized welcome email.
Process
The workflow starts when a registration or order event is triggered in Thinkific, creating a new row in a Google Sheet. It is captured in n8n, then data is cleaned and validated, then inserted into the users and orders tables in Supabase. Finally, Gmail API generates a customized welcome email.
Data Touched
users, orders; Google Sheet used as a staging log.
Measurable Benefit
What used to require manual registration and email writing now runs automatically. The result: no missed records, consistent onboarding, and faster student engagement from the very first interaction.


Workflow B — Document Ingestion for RAG
Objective
Transform static academic materials (PDFs of theory, exercises, FAQs) into a dynamic, searchable knowledge base by embedding them into a vector store accessible to AI agents.
Process
Each file is broken into text chunks, enriched with metadata, and converted into embeddings. These vectors are then stored in the rag_documents table (Supabase). When an AI assistant needs to answer a specific query, it retrieves the most relevant fragments based on semantic similarity.
Data Touched
rag_documents containing content, metadata, and embeddings.
Benefit
Enables AI agents to ground their answers in the academy’s real materials, producing precise replies to student questions while creating a scalable knowledge base for future use.


Workflow C — SEO Blog Pipeline
Objective
Build a reliable blog pipeline that balances automation and human oversight: drafts are generated automatically, but publishing always includes a fast approval step.
Process
Once triggered, the system goes through multiple AI nodes that execute specific and separate actions such as generating H2/keywords structure, drafting, metadata, and internal links. Then a WordPress draft is generated with all the info and waits for human approval, publishing then the post. At the same time, it records the entry across three dedicated tables—content, metadata, and performance—ensuring every piece is traceable and analytics-ready.
Benefit
Saves significant time in content operations, standardizes the workflow, and provides structured data for measuring performance and SEO impact.


Workflow D — E-mail Marketing
Objective
Use automation to strengthen student relationships and maximize conversion opportunities: send reminders if a web form question hasn’t been answered in two days, reach out to new users who haven’t purchased, keep enrolled students engaged with periodic messages, etc.
Process
Each campaign follows the same pattern: detect the right condition—unanswered question, no order linked to a new user, or time since last purchase with actual alumns. Then generate and send a personalized email within the period of time you want. This ensures consistent and timely contact across different scenarios, and it’s fully customizable for future needs.
Data Touched
incoming_emails (thread IDs and timestamps), users, and orders.
Benefit
Guarantees systematic and customizable follow-ups, prevents lost opportunities, and produces measurable improvements in both response rates and conversions without wasting time.


Workflow E — Email Triage & AI-Assisted Drafts
Objective
Centralize and streamline email management by automatically classifying incoming messages, preparing contextualized draft replies, and preserving full conversation history for better tracking.
Process
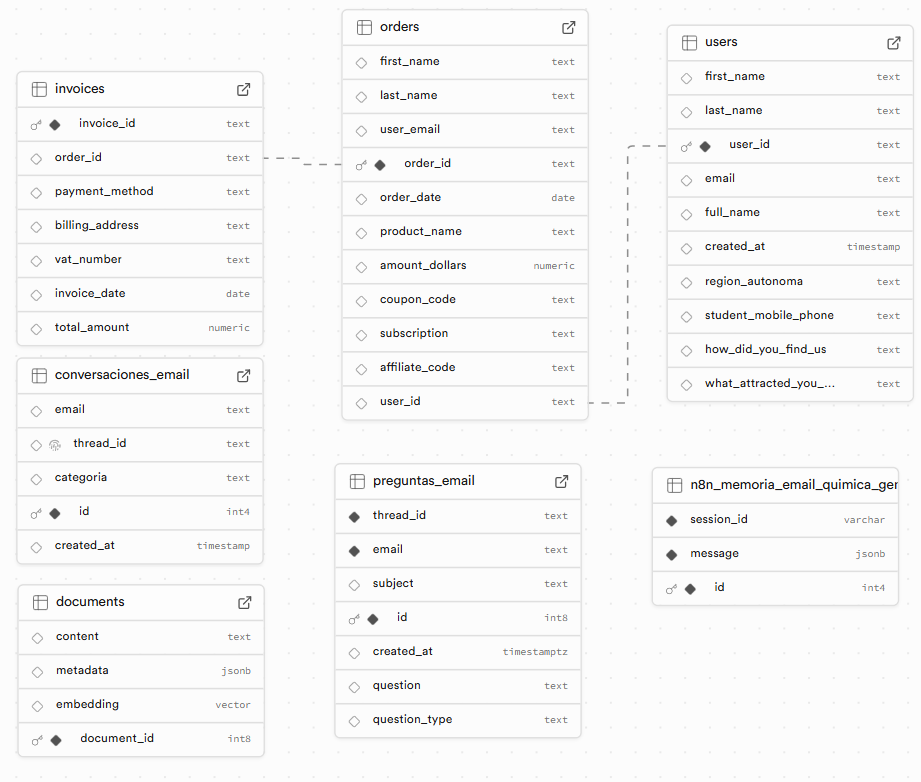
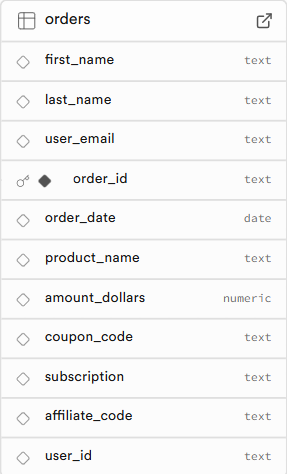
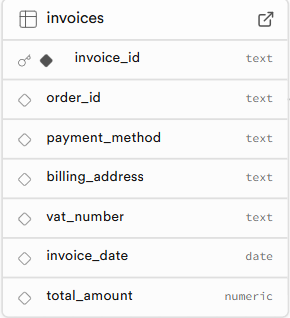
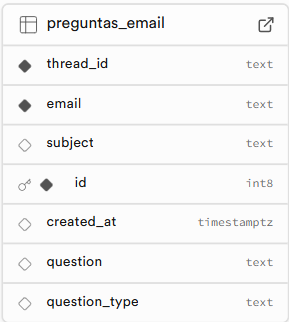
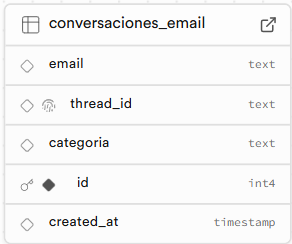
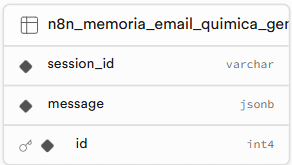
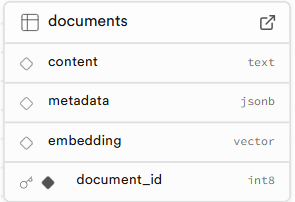
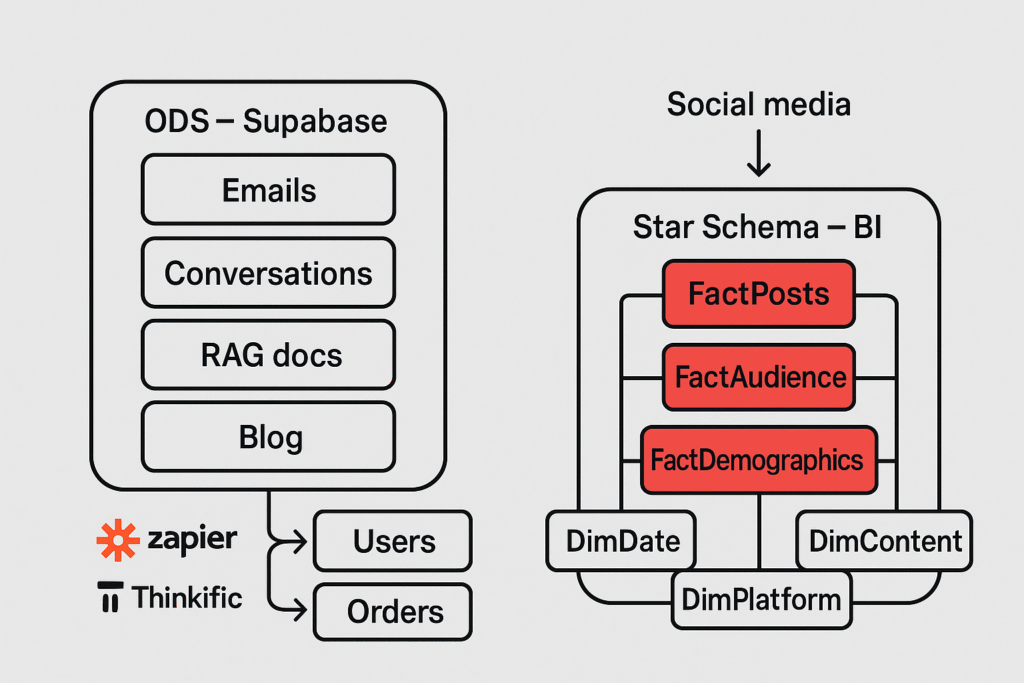
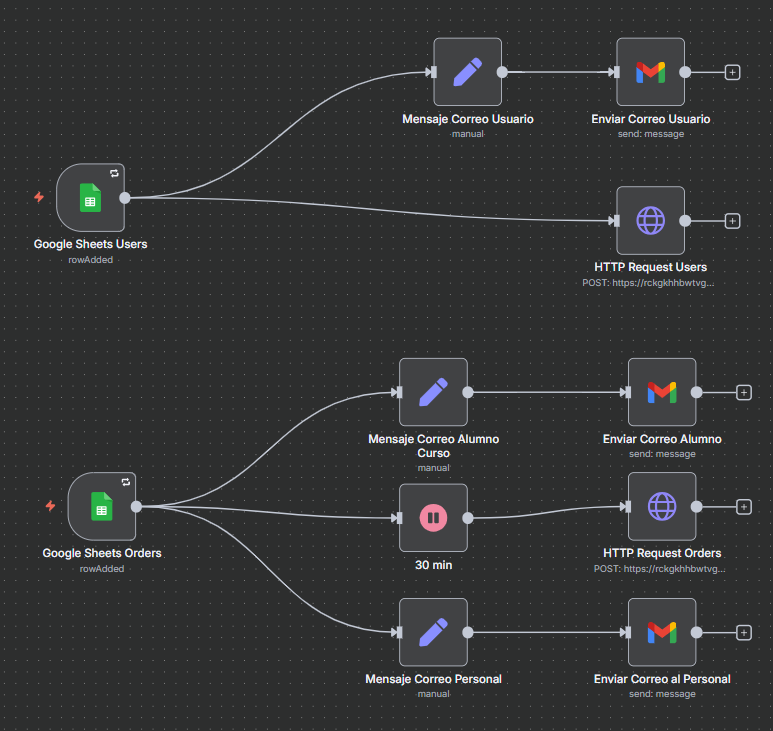
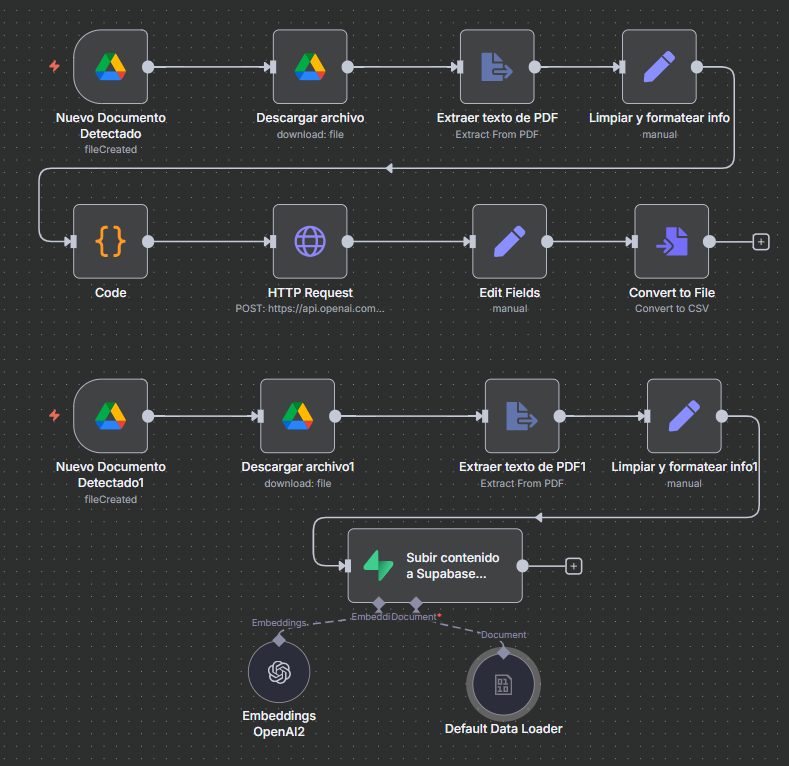
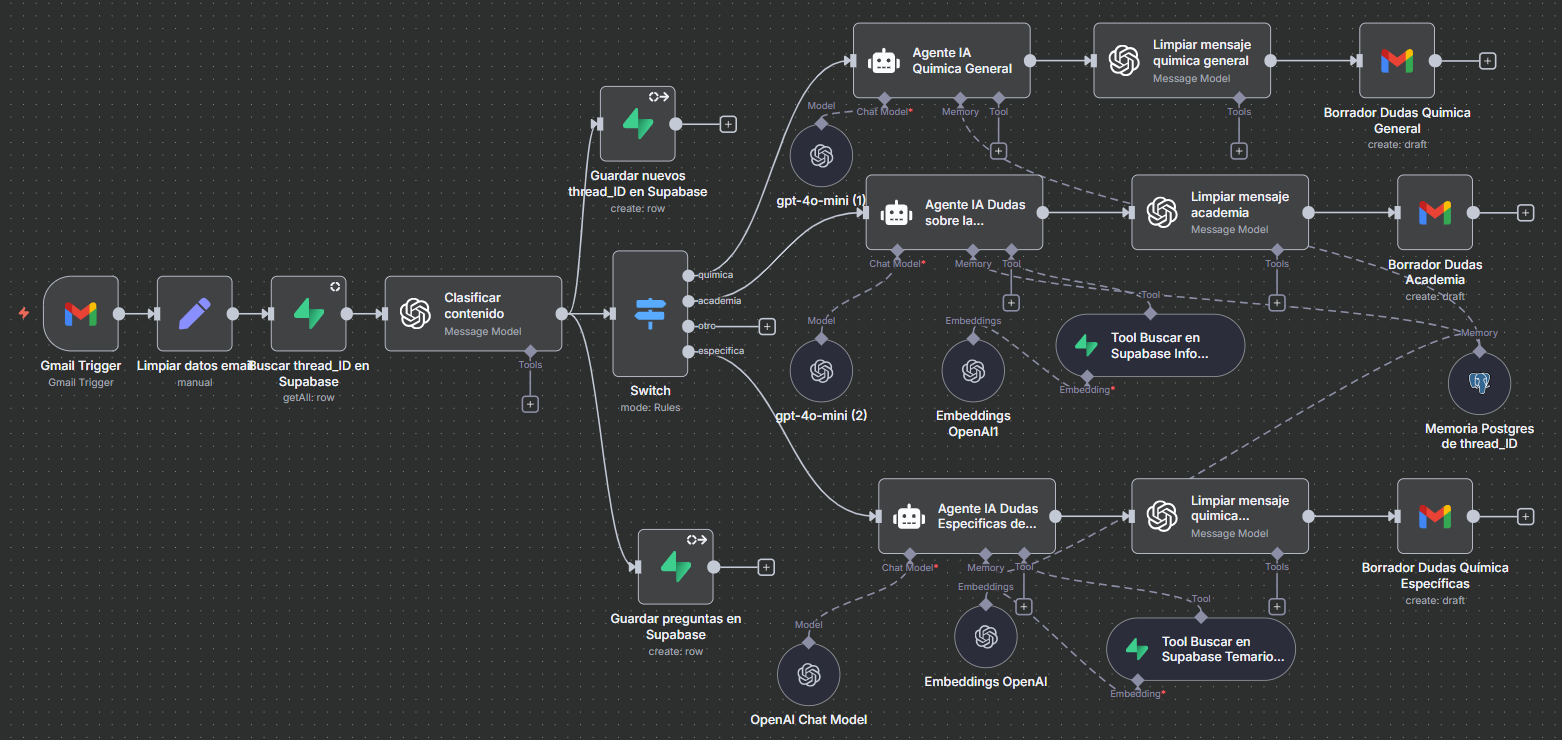
Every email entering the inbox is parsed for sender, subject, and body. The system checks existing threads in incoming_emails to maintain context. Messages are then categorized (academy, chemistry, specific, or other) and separated into different AI agents depending on the category. All emails and questions from people are stored in Supabase with the ID, email, subject and text. If needed, rag_documents provide additional knowledge of the business to the agents. Agents also have a Postgres memory to know context of previous messages if needed. Finally, a personalized draft is written and saved in Gmail, seamlessly attached to the ongoing conversation.
Data Touched
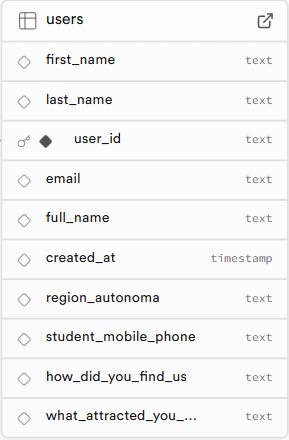
incoming_emails, n8n_conversation_history, with optional queries in Supabase to rag_documents for context.
Benefit
This automation reduces the heavy workload of drafting answers (dozens per day), ensures professional and consistent communication, maintains full auditability, and supports funnel metrics by tracking each interaction.


Workflow F — Social Metrics Harvesting
Objective
Centralize social media performance data by automating metric collection from multiple platforms, making it ready for cross-platform BI analysis.
Process
Each run collects follower counts, impressions, engagement rates, and other metrics. The data is normalized into a consistent schema, logged in Excel/Sheets for dashboard refresh, and persisted in Supabase across six RRSS tables (facts and dimensions). More info will be available in the Power BI section.
Data Touched
Six RRSS tables; Excel/Sheets serving as the Power BI data feed.
Benefit
Replaces hours of manual reporting with automated, structured data. Ensures daily and weekly KPIs are always up to date, supporting more accurate and timely business decisions.


Social Media BI Analytics Dashboards
In this part of the project, I focused on creating dashboards that provide a clear view of social media impact, tracking reach, growth, engagement, and website clicks. They highlight which platforms and content perform best, while turning metrics into actionable insights for strategy. Since the academy is just starting in social media and little data was available, I built a fictional database mirroring the n8n workflow structure.
KPIs
Include reach/impressions, video views, follower growth, engagement rate (likes, comments, shares), etc.
Segmentation
Dashboards allow slicing by platform (Instagram, YouTube, TikTok, Facebook), content type, or campaign timeline to understand where performance is strongest.
Data Feeds
Powered by Excel/Sheets refreshed via n8n, though in the early stages I relied on a fictional dataset with the same workflow structure to simulate real activity until more authentic data became available.
The report isn’t mobile responsive yet, sorry.


Results & Impact on Efficiency and Growth
In this part of the project, I focused on creating dashboards that provide a clear view of social media impact, tracking reach, growth, engagement, and website clicks. They highlight which platforms and content perform best, while turning metrics into actionable insights for strategy. Since the academy is just starting in social media and little data was available, I built a fictional database mirroring the n8n workflow structure.
1) Time & Cost Savings ⏱️
Manual documentation of users, orders, invoices, emails, and conversations quickly becomes a waste of time for a new company with 1–2 people. Each event requires immediate attention and disrupts daily work, easily taking 15–45 minutes a day. Drafting structured, professional replies to 10–20 daily questions could take up to two hours. Automating these tasks has been transformative: welcome emails, records, and draft replies are now generated instantly, saving 2–3 hours each day and keeping communications consistent. Moreover, it will get better in the future as more info and alumns are in the academy.

2) Operational Efficiency Gains ⚡
With automation, human error is no longer a bottleneck. No more missing registrations, duplicate records, or inconsistent email replies. Workflows ensure responses are faster and more reliable, meaning students and families receive timely, professional answers. Beyond speed, these gains also allow me to handle a growing student base without adding extra manual work, keeping operations lean as the academy scales. At the same time, n8n workflows integrate seamlessly across Gmail, Supabase, and Thinkific, ensuring each process connects without friction.

3) Reliable Data Integrity ✅
A robust Postgres database in Supabase brings order and traceability. SQL rules enforce consistency through foreign keys, required fields, and data type validation. Every entry is timestamped, ensuring clear audit trails. Compared to spreadsheets scattered across different platforms, the system now provides a single, trusted source of data for analysis. This structure also makes it easier to feed Power BI dashboards with accurate, up-to-date information

4) Technical & Business Learnings 🧩
The journey itself was just as valuable as the outcome. I learned how to manage APIs, configure a VPS for n8n, set up OAuth2 authentication with Google Cloud, and work with embeddings and RAG for AI use cases. I improved my SQL capabilities for analysis and built Power BI dashboards to track social media performance. On the business side, I deepened my understanding of key **online metrics—funnels, cohorts, retention, LTV, and engagement—**connecting technical data work directly to sales growth and strategy, despite not being deep covered here.


Results & Impact on Efficiency and Growth
In this project, a lot more was covered, such as funnels, conversions, and marketing tools in general, but these are tracked with automatic platforms like Google Console, Google Analytics, or Thinkific sales tools. They are useful, but not as directly connected to the core of data analyst work.That is the reason why I am not going further with these.
Conclusions:
The academy’s operations have been reshaped by automation and data-driven practices. Processes that once consumed hours are now executed automatically, student communications are immediate and consistent, and insights from social media and sales are available at any time. This has proven the business value of time savings, faster decision-making, and scalable operations.
My role as Data Analyst was to design and maintain the backbone: a relational database in Supabase with SQL controls, automated workflows built in n8n, and Power BI dashboards that turn raw data into actionable insights. This combination provided not only efficiency but also a reliable foundation for future growth.
Next Steps:
The roadmap includes strengthening the data warehouse with more dimensions, integrating additional APIs, expanding Power BI dashboards to cover the full student funnel, and experimenting with predictive models to anticipate retention and sales trends.
Personal Note:
For me, this project has been more than just a technical exercise—it was the chance to turn real business problems into data-driven solutions, and being able to do it with my partner in our own product. Seeing how much time we save every day is rewarding, but even more so is realizing how these skills now position me to tackle larger challenges in any organization.